Cancel
Start searching
This search is based on elasticsearch and can look through several thousand pages in miliseconds.
Learn more
The Elastic Stack has become an important part of our projects and also of my day-to-day work. It's hard to imagine how we could keep track of and evaluate the masses of information that our customers' servers write to log files every day before we started analyzing them with Elasticsearch and Kibana. In addition to the classic ELK stack for technical log file analysis, we can now also offer customers customized real-time analyses of business data based on the Elastic Stack.
Users of the Elastic Stack and the developers behind these products came together for a day in the impressive setting of the Kapitol theater and concert hall in Frankfurt-Offenbach. In short and snappy presentations, the respective core developers first showed what is already possible today with version 5.0 of Elasticsearch, Kibana, Beats, Logstash and X-Pack and what is planned for 2017.

Particular attention was paid to the Timelion module. The former hobby project of the original Kibana author is now coming of age and allows complex analyses to be performed on the data and meaningful graphs to be generated using a powerful description language. The Timelion graphs can then be used in the familiar Kibana dashboards and of course react to the widgets available there.
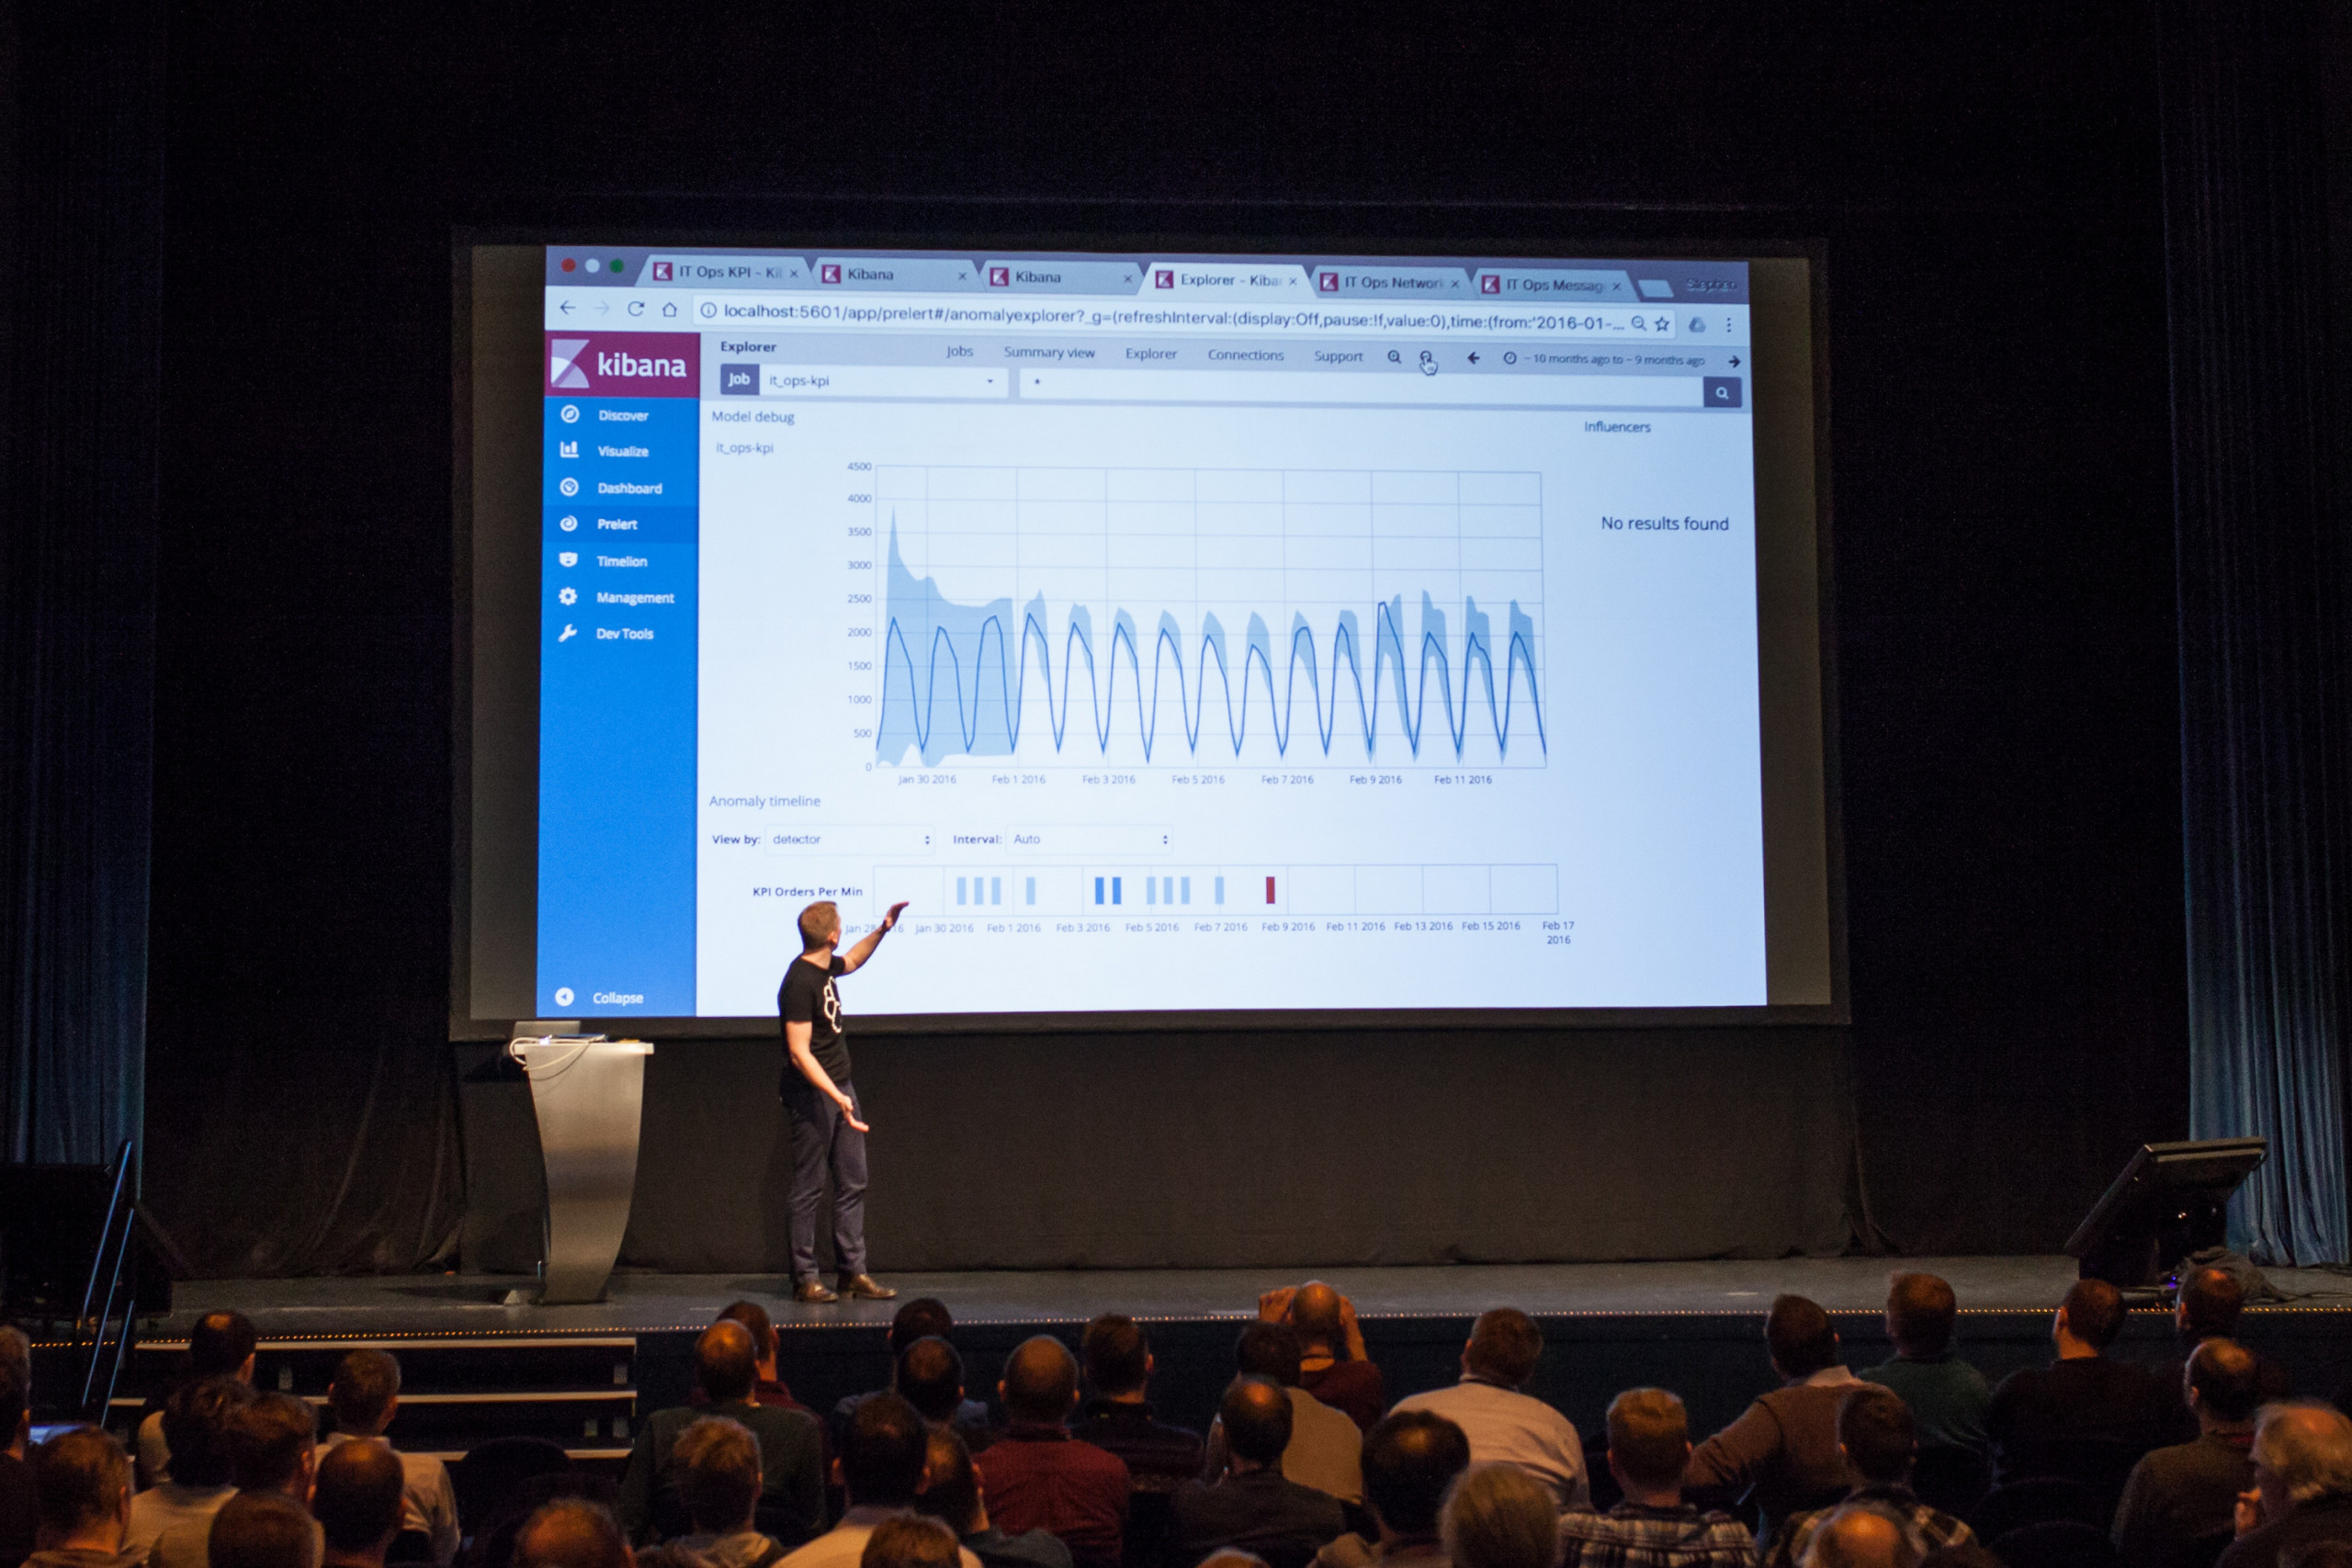
Tech lead Steve Dodson then introduced Prelert. Originally developed by his own company, Prelert is a behavior-based analysis program that was recently acquired by Elastic and will be the most exciting new Kibana module for me.
In an impressive presentation, Steve showed how Prelert recognizes patterns in time-based data thanks to "Unsupervised Mashine Learning", displays deviations in these patterns and generates alerts from them - before a serious failure has already occurred. It also learns correlations and connections between a wide variety of data - for example, logs from different services and servers - and thus helps to investigate the causes of a problem.

The release of the revised Kibana module is expected in mid-2017. However, it will not be for everyone. The license for Prelert requires at least an Elastic Stack Platinum Subscription.
In two workshops, concrete scenarios from the field of security were used to show what is possible with the modules from the Elastic Stack.
The first scenario imported log data from SSH authentication using FileBeat and differentiated between positive and failed login attempts by valid users and the brute force attack by an attacker. After detecting a positive brute force attack, the Watcher module sends an e-mail with relevant functions.
The second scenario dealt with the detection of access to websites with malware - in real time and for subsequent analysis. For this purpose, PacketBeat was used to collect the network packets from DNS requests directly at the proxy and pass them on to Elasticsearch via Logstash. With the help of Perlocator Queries, the documents in the Elasticsearch cluster can be analyzed directly and alerts can be generated in real time for hits.
The documents stored in Elastcisearch can of course also be analyzed retrospectively at any time. This means that when new threats become known, the clients in the network that have accessed the compromised URLs in the past can be identified immediately and measures can be taken.
In addition to the presentations and workshops, the discussions between users of Elasticsearch products were of course not neglected. The numerous "Ask-Me-Anything" stations, where Elasticsearch employees were able to competently answer any specific question, were particularly practical.
All in all, the "small" Elastic conference was a well-rounded and recommendable event.