Cancel
Start searching

This search is based on elasticsearch and can look through several thousand pages in miliseconds.
Learn more
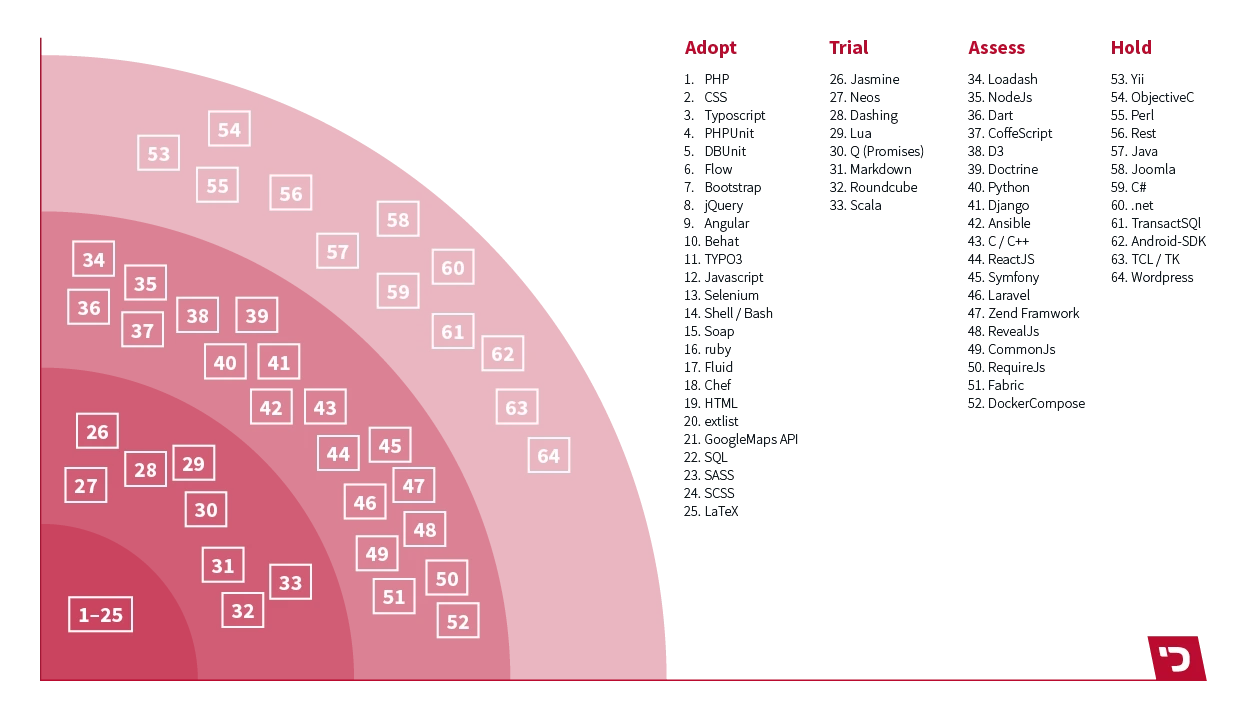
The Technology Radar is a graphical representation of all the tools and techniques that a developer, a Scrum team, or even an entire company is working with during a specific time period. The technologies are classified by clusters (for example, front-end or Backend technologies), by implementation status (“on hold” – wait and see, “assess” – evaluate, “trial” – test, and “adopt” – implement) and by changes over time (new status or no change since the radar’s last update). Of course, it also explains what each of the technologies presented does and why—or why not—developers should use them in the future. What might the whole thing look like? For example, like this:
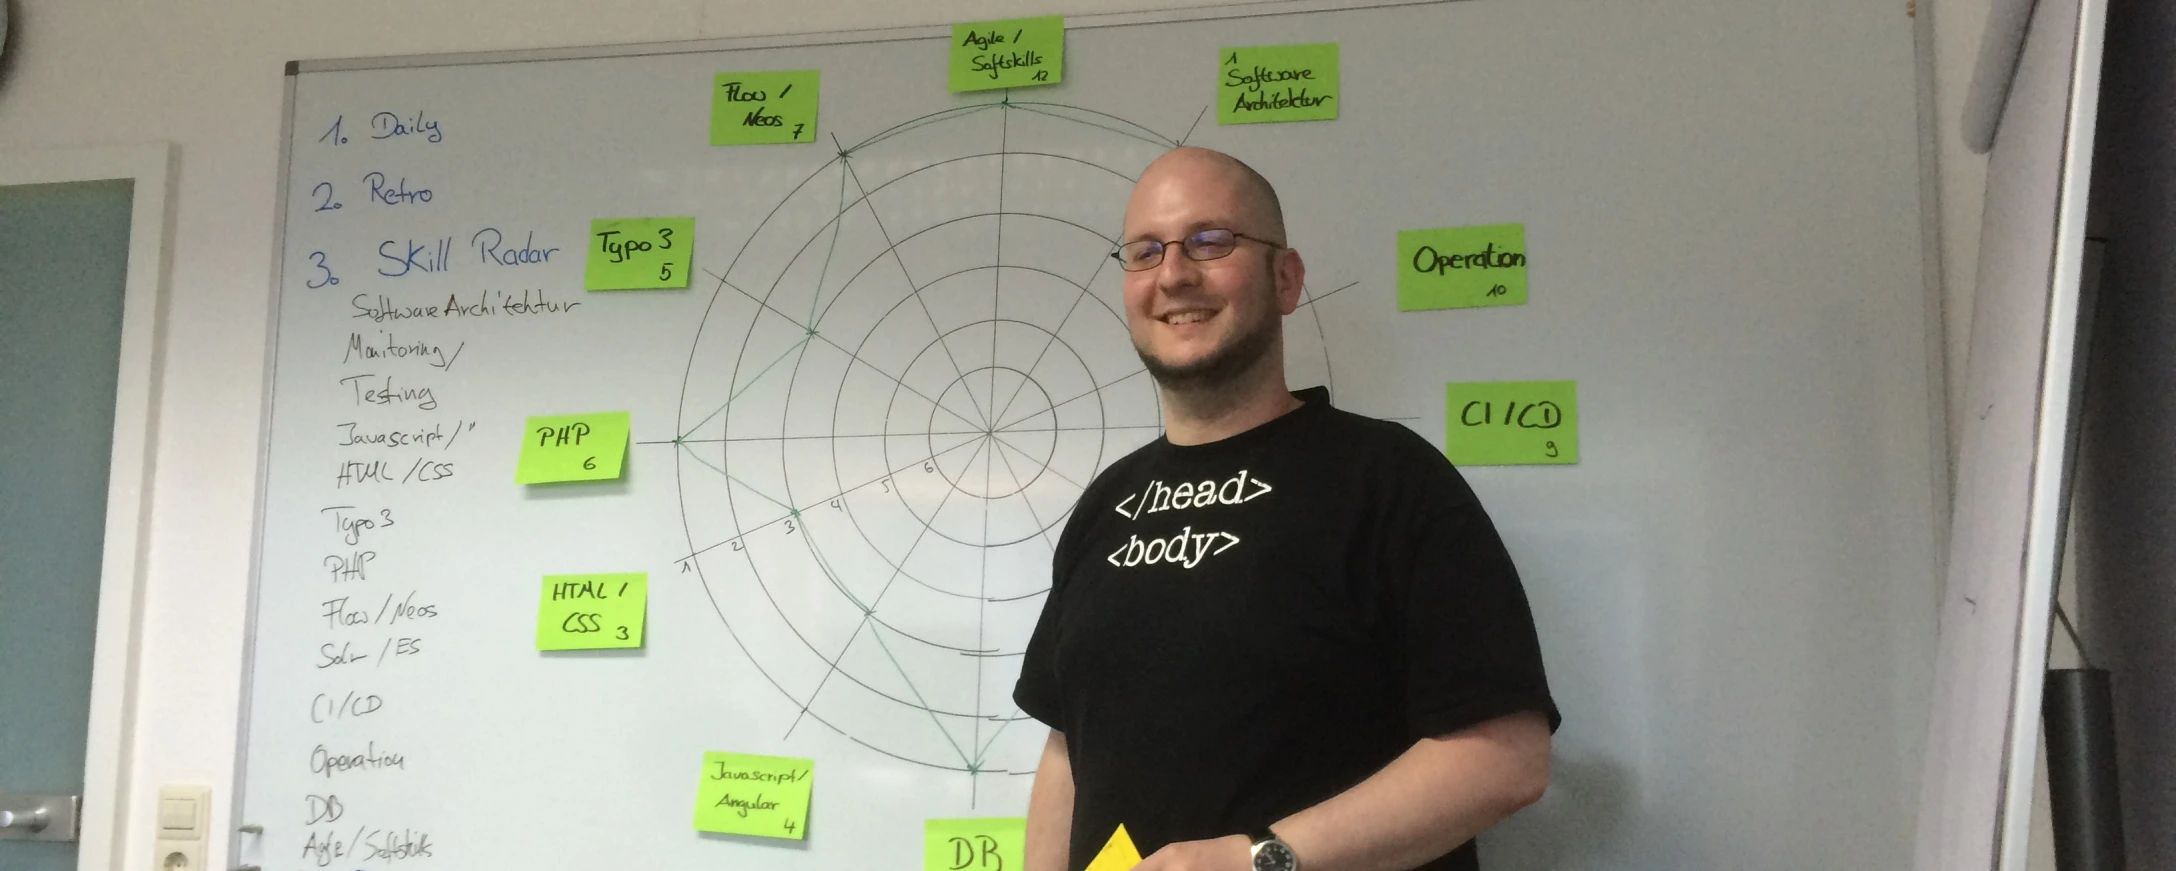
The Technology Radar is perfectly complemented by the Skill Radar. While the former shows technical developments within the company, the latter illustrates the personal skills of a developer, a Scrum team, or the entire company: Which tools and techniques are I/we familiar with, and which ones are we less familiar with? In which areas am I/are we already well-positioned, and where do I/we still need to improve? A commonly used representation of the Skill Radar is the so-called spider chart, in which various subject areas (for example, PHP) intersect with different proficiency levels (ranging from “never heard of” —in the center of the chart—to “I can give presentations on this,” which forms the outer edge of the web) intersect—thus forming a sort of spider web. To determine a developer’s proficiency level, self-assessment is compared with others’ perceptions—in other words: How do I rate myself? How do others on my team assess me? And where do our assessments align? This results in a personalized competency profile for each developer. When all individual competency profiles are combined, an overall profile of the company emerges. It might look something like this, for example:
Technology and skill radars aren’t just pretty to look at—they’re also helpful management tools: The Technology Radar provides an overview of technological developments within the company and documents progress in innovation; the Skills Radar, on the other hand, highlights what the developers are capable of, reveals skill gaps, and thus simplifies the planning of resources, training, and vacation cover, as well as recruitment. Both radars are also helpful tools for marketing: Prominently displayed on the website, they illustrate which new technologies the developers are working on, how systematically they approach these projects, and what they’re capable of—and thus, how innovative and cutting-edge a company is. This is also true for punkt.de